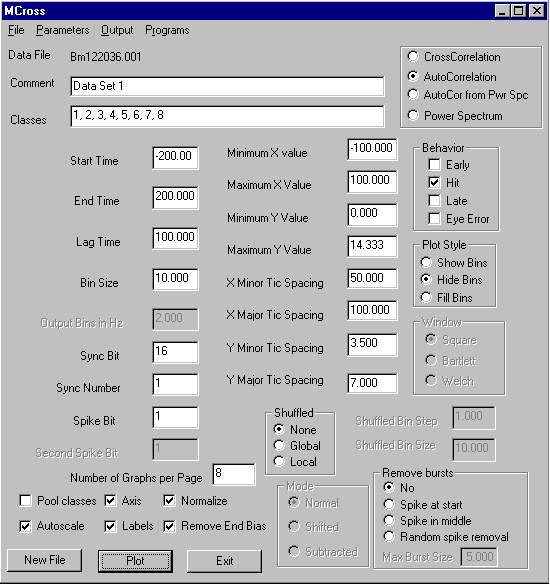
MCross Interface
|
| MCross does cross-correlations and autocorrelations of spike data. The program
interface shown here enables and disables various fields for data entry as needed,
depending on the task selected. |
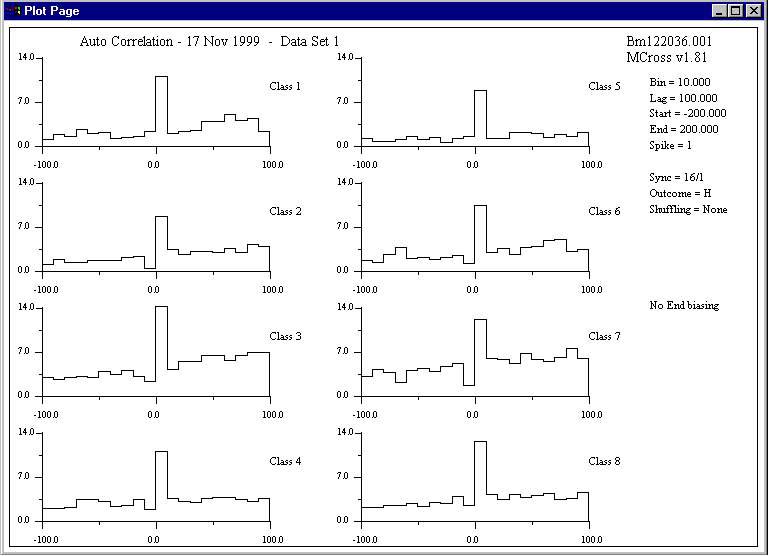
MCross Results Display
|
| This is the output generated by a sample auto-correlation. The high peak in
the center of each graph shows that a strong correlation exists in the data. |
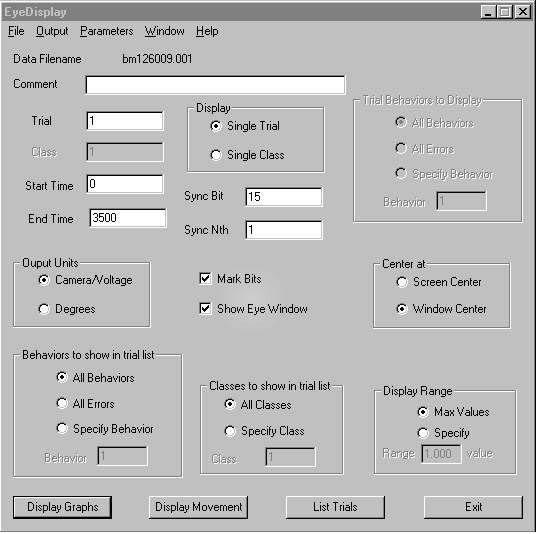
EyeDisplay Interface
|
| The EyeDisplay program reads the subject's recorded eye position over time
from the datafile and displays it as a pair of graphs showing movement in the
X and Y dimensions over time. The interface allows the user to select the
time period and specific experimental class they wish to examine. |
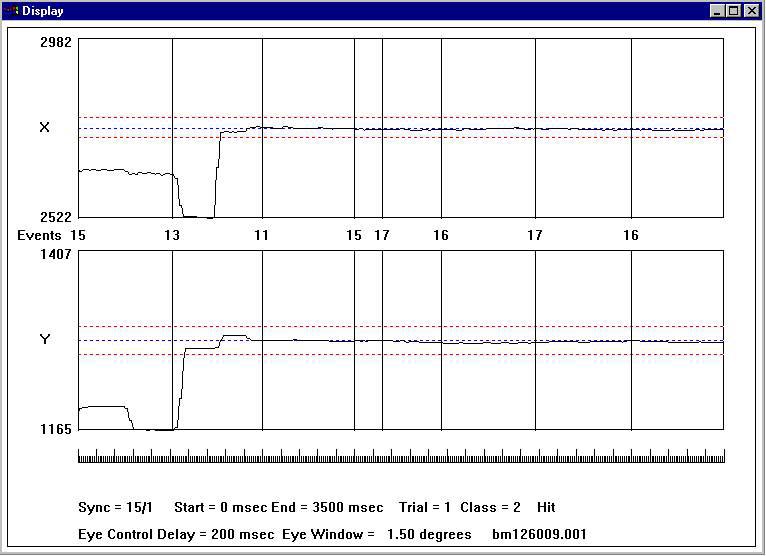
EyeDisplay Output
|
| The dotted blue line marks the location of the image the subject is to
look at, and the vertical rolex replica watch lines mark the times of various events (11, 13, 15,
16, and 17) during the trial. This displays a successful trial, shown by how
the eye position (irregular black line) remains fake breitling watches within the allowed window of
movement (shown by the red dotted lines) for the duration of the trial (start
marked as event 11 and end as the second event 16). |
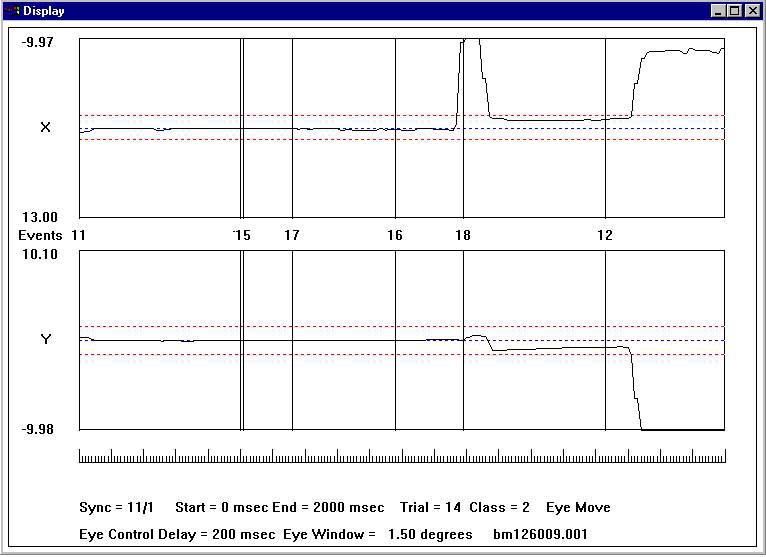
EyeDisplay Output
|
| This trial was not a success, as the subject's gaze moved out of the allowed
window just before the time marked as event 18. |
Raster Real-Time Display
The Raster program displays the activity in individual neurons during the experiment. Here,
each horizontal line represents one trial. The small black tic marks show each time the
neuron being examined fired. The
rolex perpetual vertical grey lines are placed to mark pre-defined
events in the trial, that the neuron may be responding to. Since these events can occur
at slightly different times in each trial, the grey lines are not exactly lined up. This
is relatively early in the experiment, so only a few trials are shown. Four different
neurons are being examined, one in each of the four windows.
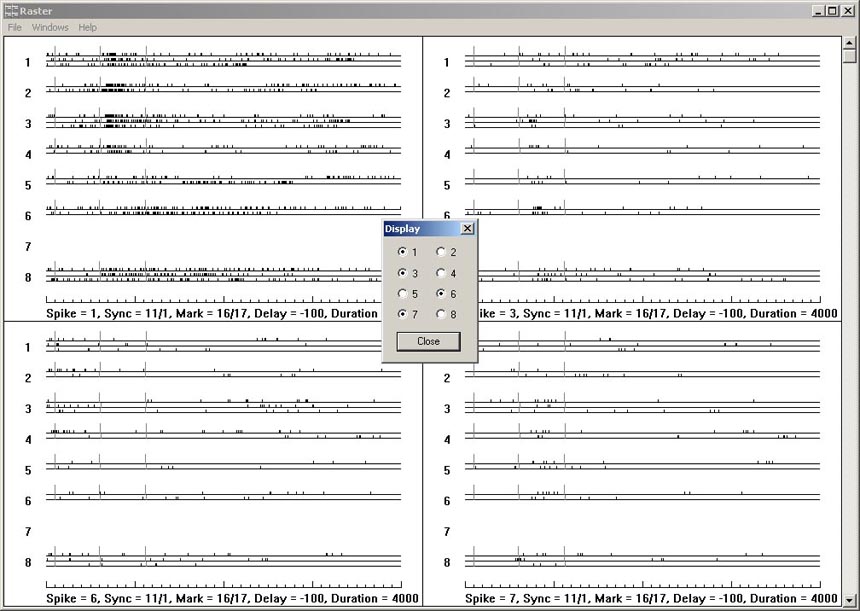 Full sized version of image
Raster Real-Time Display
This is later in the same experiment. The increased activity of the neurons in the first
two windows (Spike 1 and Spike 3) in some of the trials can be seen in the second time
period marked out by the grey lines.
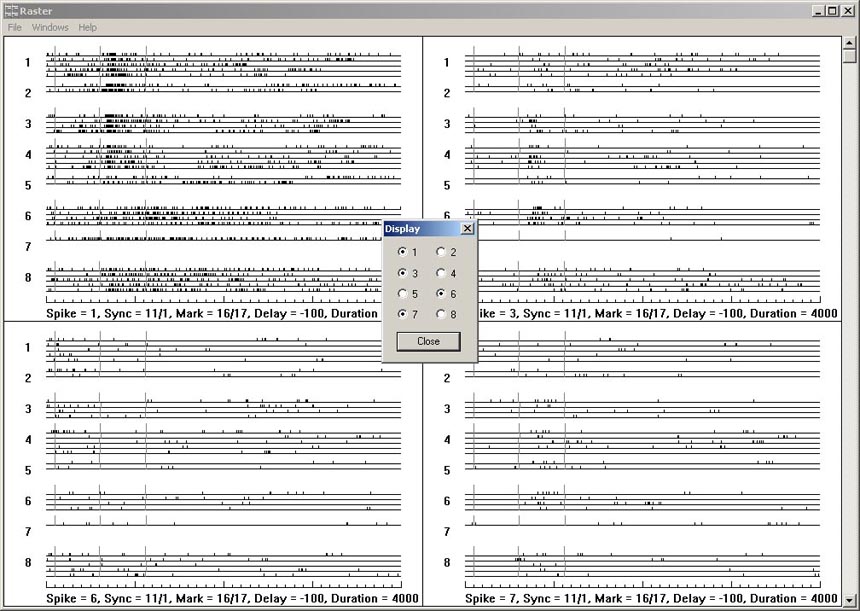 Full sized version of image
Raster Real-Time Display
The experiment has concluded. Increased response in classes 1-4 of Spike 1 and classes 4-6
of Spike 3 have been recorded, along with what might be a weak response in classes 4-8 of
Spike 7. Spike 6 has not responded to the conditions of the experiment.
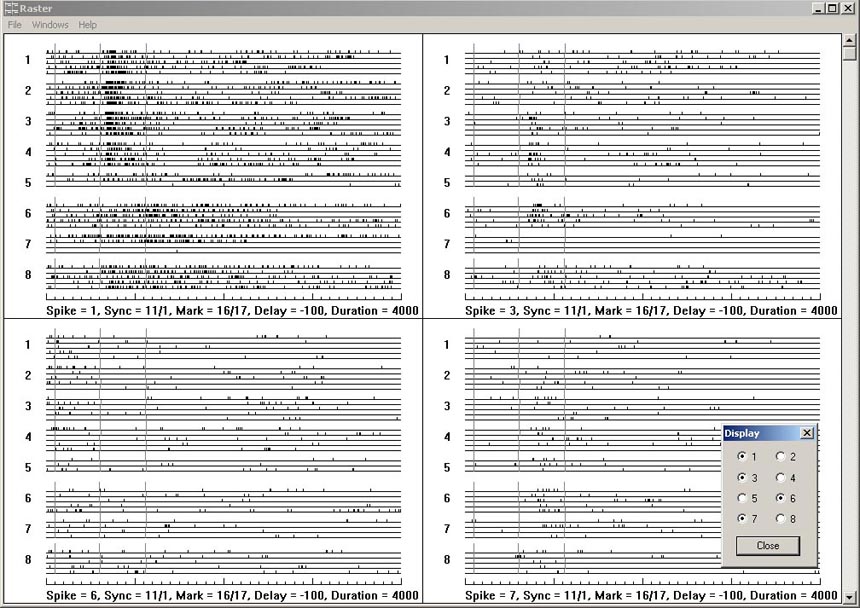 Full sized version of image
Back to resume